TradingKey - Intel Corp’s (NASDAQ:INTC) stock closed at $116.03 on September 28th down 5.67% from the previous session. The intra-day low was $114.71. After pulling back from its September 24th close of $127.39, the stock is trading at levels reflecting an operating story that is stronger than last year. Rapidly growing AI and data center businesses have improved profit margins and manufacturing efficiency. Investors want to know if these improvements outweigh the loss of foundry business, high cash spending and dilutive stock events.
The Core Business Is Recovering
Last quarter, Intel reported a 25% year-over-year increase in revenues to $16.1 billion. GAAP gross and operating margins also improved to 40.4% and 11.1% respectively from 27.5% and -24.7% respectively.
Managers said stronger factory output and higher customer demand led to better chips. Better factory output and lower cycle times are important because the main processor business is now healthier and more profitable thanks to better client demand and foundry expectations. It is good to rely on foundry expectations in the future, but it is better to have positive evidence from the processor business in the present.
Data Center and AI Is the Standout Segment
Data Center and AI chips brought in $6.3 billion, up 59% from the previous year. Client Computing and other Physical AI chips brought in $8.9 billion, up 13% from the previous year. Most important is the shift toward data center and away from traditional clients. The focus on cost cutting and efficiency improved earnings and cash flow. Margin expansion will continue as the data center business ramps up. The most important question is what is Intel’s foundry profitability and capex investment for the quarter?
The GAAP Loss Needs Normalization
Intel Corporation recorded a net loss of $11.0 billion for the quarter ending June 27, 2026, with net loss attributable to Intel of $11.0 billion, or $2.16 per share. Non-GAAP net income was $2.2 billion, or $0.42 per share. Non-operating mark-to-market losses of $12.5 billion primarily related to escrowed shares tied to Intel’s U.S. Government agreement impacted the loss. Intel's management noted that GAAP loss should not be an indicator of the demand for Intel's processors. Additionally, adjusting the loss for the expenses would provide a more realistic picture of the costs for Intel's expansion, which is not presented in the press release. For the valuation of Intel, operating income and other metrics should be evaluated as opposed to Net Income.
Foundry Growth Is Mostly Internal
Intel's foundry segment generated revenues of $5.8 billion for the second quarter of 2026, representing an increase of 31% from the second quarter of 2025. Of that total, approximately $5.5 billion was intersegment revenue and only about $293 million was external revenue in Q2. Foundry services reported an operating loss of $2.1 billion for the quarter. The long-term objective of the investment should be focused on reducing Foundry operating losses while also focusing on customer expansion.
18A and High-NA Progress Is Tangible
Intel 18A-P entered risk production in June 2026. Intel is also incorporating High-NA EUV lithography in the fabrication of some processors from the Panther Lake architecture. High-NA EUV technology was meeting expectations and showing improvement in September. Intel and ASML said more than one million wafers had been processed across early tool certification and testing, research and development, and selected high-volume production work, including specific layers for a subset of Panther Lake processors. The million wafers produced, however, do not mean Intel will be able to manufacturer processors for external customers in the volumes and at the rates needed to be profitable.
SK Hynix Talks Are Optionality, Not a Base Case
According to Reuters, SK Hynix and Intel are considering a partnership in which SK Hynix would produce memory chips at Intel’s planned Ohio fabrication facility. Other potential partnerships were also being discussed. An agreement has not been reached by the two parties.
SK Hynix also stated that no agreement had been reached. Intel also did not comment on the potential partnership. Since an agreement has not been reached, this situation should not be included in base-case scenarios for Intel. Improving utilization of Intel’s U.S. factories would be the goal of any potential partnership.
The $20 Billion Equity Raise Buys Time but Adds Dilution
In August, Intel expanded and priced a common stock offering initially totaling $20 billion. Intel sold 210.5 million shares for $95 each. The underwriters then exercised their option in full for an additional 31.6 million shares, bringing total shares sold to about 242.1 million and expected net proceeds to approximately $22.62 billion. Intel stated the proceeds would be used for general corporate purposes, which may include capital expenditures and working capital. Intel expects the proceeds would be used for the foundry business. The stock offerings significantly increased Intel’s liquidity and would help fund the buildout of the foundry business. The offering also materially increased Intel’s share count, diluting existing shareholders.
Cash Flow Still Shows the Cost of Expansion
In the second quarter, Intel recorded operating cash flow of $7 billion. Adjusted free cash flow was negative $8.4 billion. Intel’s adjusted free-cash-flow calculation included $2.65 billion of gross capital expenditures, $617 million of finance-lease payments and a $12.22 billion net outflow from partner contributions/distributions, partly offset by $60 million of capital-related government incentives.
Intel’s operating cash flow was positive, but the company’s broader manufacturing and partnership funding structure pushed adjusted free cash flow deeply negative.
Q3 Guidance Sets the Next Operating Test
In the second quarter, Intel's revenue increased 25% to $16.1 billion. Intel expected Q3 revenue of $15.8-16.8 billion. Intel expects non-GAAP gross margin of 42% and GAAP gross margin of 41% for Q3. Intel projects Q3 EPS of $0.38 and $0.31 for non-GAAP and GAAP, respectively.
The main focus of the report is the data center where the persisting momentum will likely result in better margins. Losses from Intel's foundry business is also expected to continue declining.
Intel Technical Analysis: INTC Retests $114.59 Demand Zone After $126.78 Rejection
INTC recently closed at $116.03 after a rejection at $126.78. The selling has been dismissed to the $113.62 to $115.86 demand zone. This area previously was major resistance before the up trend. The demand zone will be tested to determine if the overall trend will continue higher. The Relative Strength Index (RSI) has lost support from the 61 level and is now at 45. Price still is above the two rising moving averages.
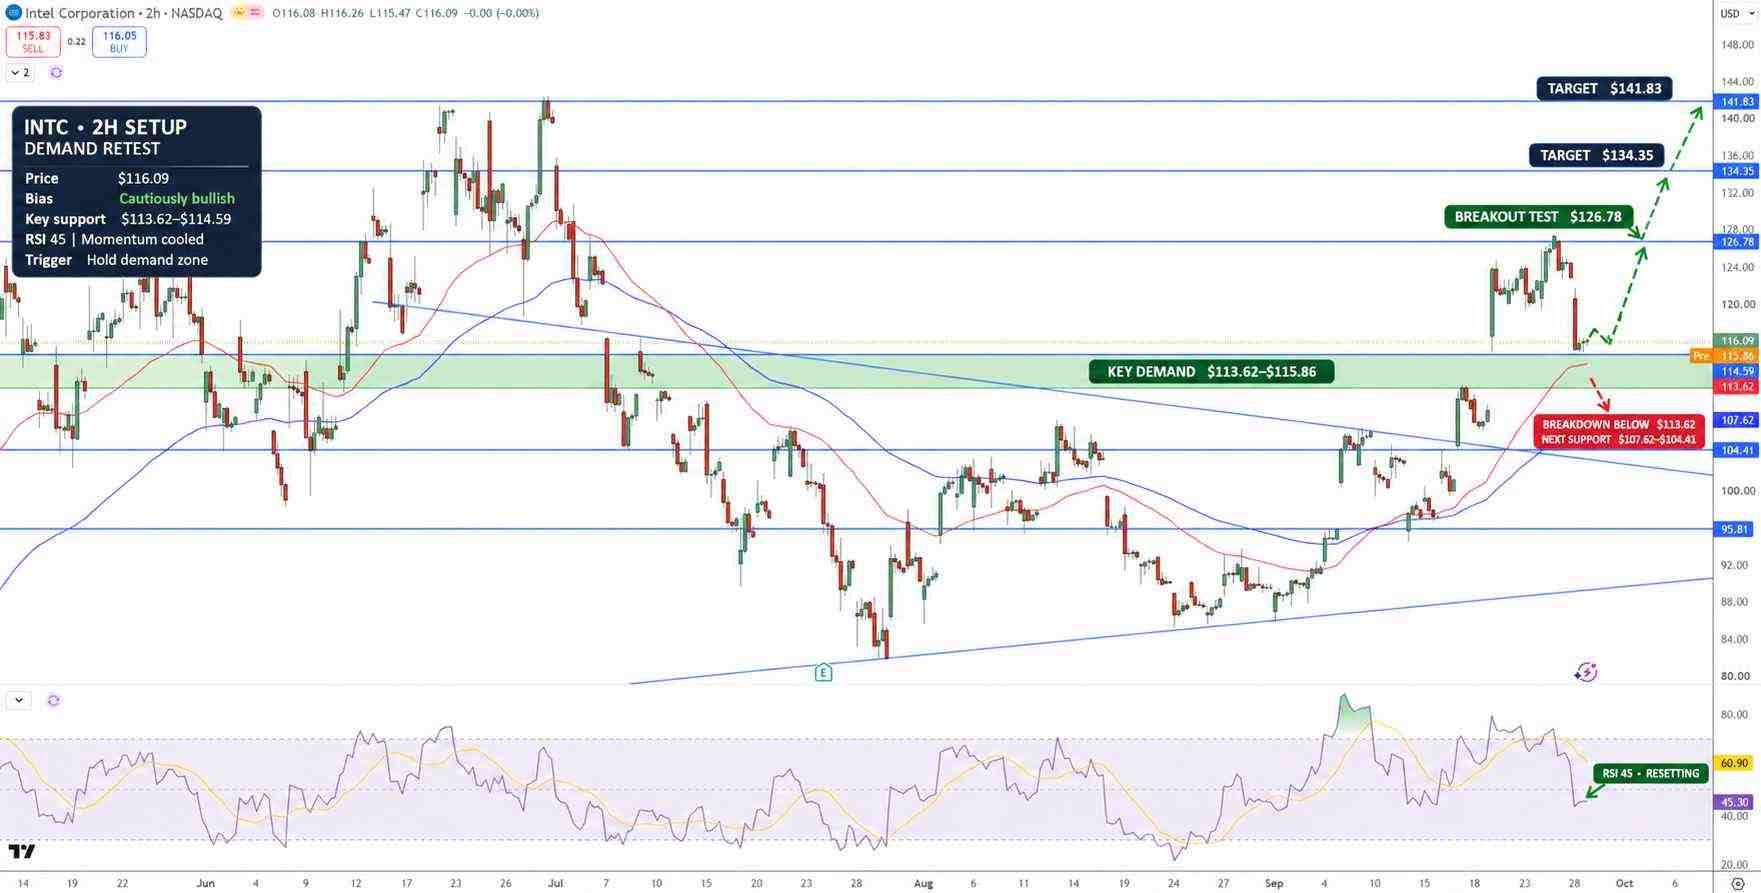
Intel Stock Price Chart - Source: Tradingview
Rising support and resistance levels are $116 to $120 and $126.78 to $134.35 respectively. Support is expected to be found at the $114.59 to $113.62 area. A break below this level would invalidate the current uptrend and support would be expected at $107.62 and $104.41 respectively.
The $113.62 to $114.59 area is major support. Rising resistance is expected at $120 and $126.78 respectively. The $114.59 to $113.62 area is expected to provide strong support. RSI currently is at 45 and is neutral to slightly bearish. A breakdown from the $113.62 to $114.59 area would have a bearish outcome and support would be expected at $104.41.
Key Levels
• Latest completed close: $116.03
• Major support levels: $114.59 - $113.62; $107.62; $104.41
• Major resistance levels: $120; $126.78; $134.35
• RSI: approx. 45
• Breakout target: $134.35 (potentially higher) from a break of $126.78
• Breakout strategy: above the $126.78 level.
Why is Intel stock in focus now?
There are multiple developments that strengthen Intel’s position in the market. There was the positive report card for the Data Center and AI businesses. 18A-P has entered risk production. Panther Lake is in high volume production. Also, the company has $22.62 billion of expected net proceeds from the August equity offering after the underwriters exercised their option in full for high tech fabrication. Have they improved foundry economics?
What level confirms a stronger INTC recovery?
In our view, a sustained 2-hour close above $126.78 would signal that the recent rejection zone has been reclaimed and would focus attention on $134.35. If the zone at $113.62 breaks down, we may lose confidence in the longer-term recovery and look for supports at $107.62 and $104.41.
Bottom Line
There are compelling reasons to believe Intel is turning around. Driven by the Data Center Group, and AI businesses, top line and operating income are increasing, and the Company is making progress with regards to various manufacturing technologies.
Given the Company remains losses on its Foundry business, further capital expenditure remains a risk, and given the Company’s adjusted free cash flow remains deeply negative despite positive operating cash flow, Intel’s stock is likely to remain range bound in the near-term. A close above $126.78 would bring the $134.35 target into focus. A close below $113.62 would negate the bullish view.
Find out more